Curiosamente, da mesma forma que apareceu… desapareceu xD
Ainda bem 

Curiosamente, da mesma forma que apareceu… desapareceu xD
Ainda bem 
Boas…
estou a tentar tb ter este tipo de grafico no meu HA…
Para já tenho um Sonoff Pow R2… mas futuramente quero adquirir um Shelly EM…
Atualmente tenho esta conf.:
sensor:

#watts
  - platform: mqtt
    name: "sonoff Wats"
    state_topic: "tele/sonoffPow2/SENSOR"
    value_template: '{{ value_json["ENERGY"]["Power"] }}'
    unit_of_measurement: "W"

#Amperes #
  - platform: mqtt
    name: "sonoff Amperes"
    state_topic: "tele/sonoffPow2/SENSOR"
    value_template: '{{ value_json["ENERGY"]["Current"] }}'
    unit_of_measurement: "A"

#Voltagem
  - platform: mqtt
    name: "sonoff Voltagem"
    state_topic: "tele/sonoffPow2/SENSOR"
    value_template: '{{ value_json["ENERGY"]["Voltage"] }}'
    unit_of_measurement: "V"

#Hoje kWh
  - platform: mqtt
    name: "sonoff Hoje"
    state_topic: "tele/sonoffPow2/SENSOR"
    value_template: '{{ value_json["ENERGY"]["Today"] }}'
    unit_of_measurement: "kWh"

#Hoje €
  - platform: mqtt
    name: "sonoff Hoje (€)"
    state_topic: "tele/sonoffPow2/SENSOR"
    value_template: >-
      {{states.sensor.sonoff_hoje.state | multiply(0.2575) | round(2)}}
    unit_of_measurement: "€"

#Ontem kWh
  - platform: mqtt
    name: "sonoff Ontem"
    state_topic: "tele/sonoffPow2/SENSOR"
    value_template: '{{ value_json["ENERGY"]["Yesterday"] }}'
    unit_of_measurement: "kWh"

#Ontem €
  - platform: mqtt
    name: "sonoff Ontem (€)"
    state_topic: "tele/sonoffPow2/SENSOR"
    value_template: >-
      {{states.sensor.sonoff_ontem.state | multiply(0.2575) | round(2)}}
    unit_of_measurement: "€"

#Total kWh
  - platform: mqtt
    name: "sonoff Total"
    state_topic: "tele/sonoffPow2/SENSOR"
    value_template: '{{ value_json["ENERGY"]["Total"] }}'
    unit_of_measurement: "kWh"

#Total €
  - platform: mqtt
    name: "sonoff Total (€)"
    state_topic: "tele/sonoffPow2/SENSOR"
    value_template: >-
      {{states.sensor.sonoff_total.state | multiply(0.2575) | round(2)}}
    unit_of_measurement: "€"
mas nao estou a perceber, quais as alterações a fazer, para ficar algo como este tutorial.
já fiz algumas coisas, mas ainda sem valores, o que é normal.
Esta solução está desatualizada, existe uma nova solução que regista os valores numa base de dados e mostra num custom card.
Assim com tanta coisa!!! Até me deu comichão no corpo… Lol
Está top… Mas primeiro não tenho que configurar os sensores??? O sonoff pow?
Sim, os sensores precisam de estar configurados. Deves utilizar o utility_meter, vê este post que explica tudo
este metodo ainda funciona?
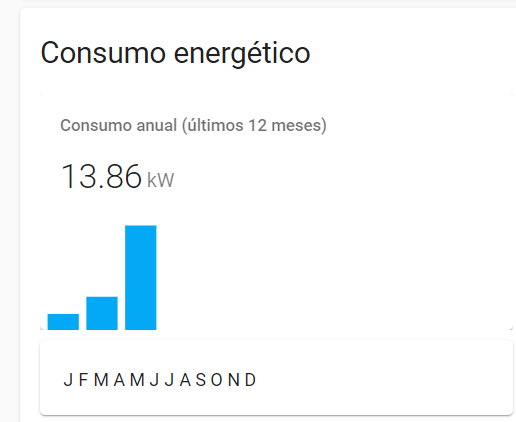
Eu gostei deste modelo, ja o consegui colocar a funcionar parte do codigo, mas a ultima parte do codigo fica em falha nao sei porque 
type: entities
title: Consumo energético
show_header_toggle: false
entities:
  - type: 'custom:mini-graph-card'
    name: Consumo anual (últimos 12 meses)
    style: |
      .state__time {
         display: none;
       }
    entities:
      - entity: sensor.energia_rede
        show_graph: false
        hours_to_show: 0
      - entity: input_text.energy_kw_month_01
        color: var(--primary-color)
      - entity: input_text.energy_kw_month_02
        color: var(--primary-color)
      - entity: input_text.energy_kw_month_03
        color: var(--primary-color)
      - entity: input_text.energy_kw_month_04
        color: var(--primary-color)
      - entity: input_text.energy_kw_month_05
        color: var(--primary-color)
      - entity: input_text.energy_kw_month_06
        color: var(--primary-color)
      - entity: input_text.energy_kw_month_07
        color: var(--primary-color)
      - entity: input_text.energy_kw_month_08
        color: var(--primary-color)
      - entity: input_text.energy_kw_month_09
        color: var(--primary-color)
      - entity: input_text.energy_kw_month_10
        color: var(--primary-color)
      - entity: input_text.energy_kw_month_11
        color: var(--primary-color)
      - entity: input_text.energy_kw_month_12
        color: var(--primary-color)
    unit: kW
    font_size_header: 14px
    font_size: 80
    bar_spacing: 8
    height: 120
    aggregate_func: last
    fixed_value: true
    group_by: date
    show:
      graph: bar
      icon: false
      legend: false
      average: false
      extrema: false
      labels: false
      labels_secondary: false
      hour24: false
  - type: 'custom:hui-markdown-card'
    style: |
       .markdown {
          padding: 0px 0px !important;
        }

        table {
          table-layout: fixed;
          width: 100%;
        }

        thead {
          display: none;
        }

        td {
          text-align: center;
        }
       content: |
       | | | | | | | | | | | | |
        |-|-|-|-|-|-|-|-|-|-|-|-|
        |J|F|M|A|M|J|J|A|S|O|N|D|
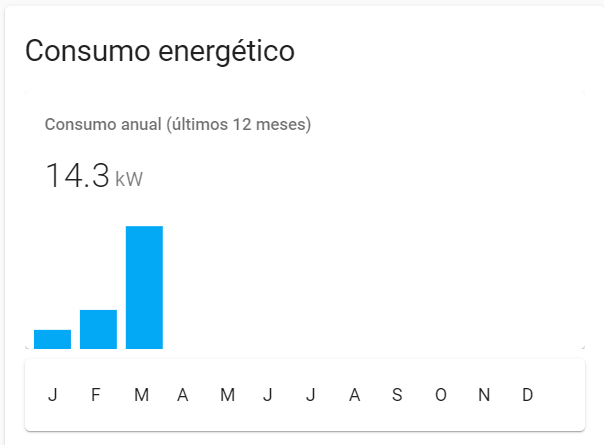
a mim funciona bem esse card, tenta limpar a cache a ver se resolve
ja o fiz e nao resolve, podes partilhar do teu codigo do card?
já não me lembrava disto:
eu ja o tinha, não coloquei foi os codigos na fonte do lovecard , agora aparece assim 
experimenta assim:
- type: 'custom:hui-markdown-card'
  style:
    .: |
      .markdown {
        padding: 0px 0px !important;
      }
    ha-card:
      ha-markdown:
        $: |
          table {
            table-layout: fixed;
            width: 100%;
          }

          thead {
            display: none;
          }

          td {
            text-align: center;
          }
  content: |
    | | | | | | | | | | | | |
    |-|-|-|-|-|-|-|-|-|-|-|-|
    |J|F|M|A|M|J|J|A|S|O|N|D|
ate que finalmente consegui afinal o codigo kk obrigado Ricardo pela ajuda

type: entities
title: Consumo energético
show_header_toggle: false
entities:
  - type: 'custom:mini-graph-card'
    name: Consumo anual (últimos 12 meses)
    style: |
      .state__time {
         display: none;
       }
    entities:
      - entity: sensor.energia_rede
        show_graph: false
      - entity: input_text.energy_kw_month_01
        color: var(--primary-color)
      - entity: input_text.energy_kw_month_02
        color: var(--primary-color)
      - entity: input_text.energy_kw_month_03
        color: var(--primary-color)
      - entity: input_text.energy_kw_month_04
        color: var(--primary-color)
      - entity: input_text.energy_kw_month_05
        color: var(--primary-color)
      - entity: input_text.energy_kw_month_06
        color: var(--primary-color)
      - entity: input_text.energy_kw_month_07
        color: var(--primary-color)
      - entity: input_text.energy_kw_month_08
        color: var(--primary-color)
      - entity: input_text.energy_kw_month_09
        color: var(--primary-color)
      - entity: input_text.energy_kw_month_10
        color: var(--primary-color)
      - entity: input_text.energy_kw_month_11
        color: var(--primary-color)
      - entity: input_text.energy_kw_month_12
        color: var(--primary-color)
    unit: kW
    font_size_header: 14px
    font_size: 80
    bar_spacing: 8
    height: 120
    aggregate_func: last
    fixed_value: true
    group_by: date
    show:
      graph: bar
      icon: false
      legend: false
      average: false
      extrema: false
      labels: false
      labels_secondary: false
  - type: 'custom:hui-markdown-card'
    style:
      .: |
        .markdown {
          padding: 0px 0px !important;
        }
      ha-card:
        ha-markdown:
          $: |
            table {
              table-layout: fixed;
              width: 100%;
            }

            thead {
              display: none;
            }

            td {
              text-align: ;
            }
    content: |
      | | | | | | | | | | | | |
      |-|-|-|-|-|-|-|-|-|-|-|-|
      |J|F|M|A|M|J|J|A|S|O|N|D|
Partilhar uma (espécie de) solução que me parece resolve a questão que o @j_assuncao, levantou no início do topic, sobre a mudança de ano e a apresentação que o gráfico teria depois - mantendo os valores dos meses, do ano anterior, ainda visíveis.
Também estou a usar a versão mais recente, partilhada num outro topic, mas admito que me agradou a simplicidade e o aspecto visual desta primeira versão.
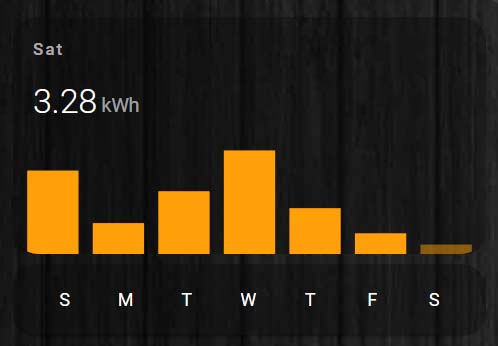
Mas, de facto, aplicando-a a um espaço temporal semanal, ainda mais cedo iria deparar-me com a tal apresentação continua, não fazendo diferença entre a mudança de semana.
configuration.yaml:
input_text:
  energy_day_sun:
    name: "Sun"
  energy_day_mon:
    name: "Mon"
  energy_day_tue:
    name: "Tue"
  energy_day_wen:
    name: "Wen"
  energy_day_thu:
    name: "Thu"
  energy_day_fri:
    name: "Fri"
  energy_day_sat:
    name: "Sat"
automation - mudança diária:
alias: Daily Update
description: ''
trigger:
  - platform: state
    entity_id: sensor.daily_energy_shelly
condition: []
action:
  - service: input_text.set_value
    data:
      entity_id: 'input_text.energy_day_{{ now().strftime(''%a'') }}'
      value: '{{ trigger.to_state.state }}'
mode: single
card:
type: entities
title: false
show_header_toggle: false
entities:
  - type: 'custom:mini-graph-card'
    name: Daily Update
    style: |
      .state__time {
         display: none;
       }
    entities:
      - entity: sensor.daily_energy_shelly
        show_graph: false
      - entity: input_text.energy_day_sun
        color: var(--primary-color)
      - entity: input_text.energy_day_mon
        color: var(--primary-color)
      - entity: input_text.energy_day_tue
        color: var(--primary-color)
      - entity: input_text.energy_day_wen
        color: var(--primary-color)
      - entity: input_text.energy_day_thu
        color: var(--primary-color)
      - entity: input_text.energy_day_fri
        color: var(--primary-color)
      - entity: input_text.energy_day_sat
        color: var(--primary-color)
    unit: kWh
    font_size_header: 14px
    font_size: 80
    bar_spacing: 15
    height: 120
    aggregate_func: last
    fixed_value: true
    group_by: date
    show:
      graph: bar
      icon: false
      legend: false
      average: false
      extrema: false
      labels: false
      labels_secondary: false
  - type: 'custom:hui-markdown-card'
    style:
      .: |
        .markdown {
          padding: 0px 0px !important;
        }
      ha-card:
        ha-markdown:
          $: |
            table {
              table-layout: fixed;
              width: 100%;
            }

            thead {
              display: none;
            }

            td {
              text-align: center ;
            }

    content: |
      | | | | | | | |
      |-|-|-|-|-|-|-|
      |S|M|T|W|T|F|S|
automation - reset semanal:
alias: Consumption Graph - Weekly reset
description: ''
trigger:
  - platform: state
    entity_id: input_text.energy_day_sun
    to: '0'
condition: []
action:
  - service: input_text.set_value
    data:
      value: '0'
    target:
      entity_id:
        - input_text.energy_day_mon
        - input_text.energy_day_tue
        - input_text.energy_day_wen
        - input_text.energy_day_thu
        - input_text.energy_day_fri
        - input_text.energy_day_sat
mode: single
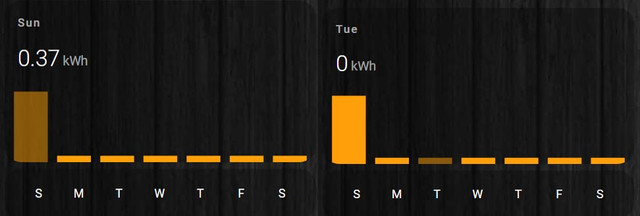
Admito que inicialmente a tentativa era passar os restantes dias para um state: unknown, pois noutros testes o state: 0 mantinha sempre uma pequena amostra de barra, nos restantes dias. Não era nada gritante mas, enfim, também não é perfeito.
Se alguém tiver uma ideia de como resolver isso agradecia!
Ex:
Semana

Mudança de semana (meia-noite - Sábado para Domingo)

Copyright © 2017-. Todos os direitos reservados
CPHA.pt - info@cpha.pt